

If you’re investing in a marketing strategy but don’t keep track of results of those actions, you may be leaving money on the table.
Analyzing data is one of the most valuable practices for your business. This is the only way to understand what is working for your audience and what you need to stop investing aside time and money on.
Instagram even has a feature dedicated solely to measuring results: Instagram Insights. From there, you can track the results of your posts, gather performance, reach and engagement data – including stories! – and get to know your audience better.
Want to know how to find this data, analyze it, and use it to your advantage? We will teach you everything, step by step! ?
What is Instagram Insights?
For some time now, social media networks have been recognizing the importance of providing data to users as their presence on these networks grows. Aiming to start with key metrics for business profiles, the platform launched Instagram Insights in 2016 for business accounts.
Since then, the feature has undergone some updates, and you can now access demographic information from your followers, as well as age and location.
Plus, through Instagram Insights we can collect data on reach, impressions, interactions, views, visits to your profile and even know the best time to post! ?
For beginners, we know that these terms all look very much the same, so let’s make it clear so no one gets confused later on:
Reach: this is the number of unique users who saw / were affected by your post. Even if someone views your post 10 times, the reach metric will count only one time per person.
Impressions: this is the number of times your post has been exposed to people. That is, if a single person saw your post 10 times, it will be counted as 10 impressions.
Interactions: this is every action a follower takes on your post (like, comment, share). Instagram Insights defines this metric as the sum of actions in your posts or profile.
Also, it’s important for you to know that Instagram doesn’t allow us to export data. Thus, if you want to have a full view of a full time period or need to present this data to someone, you must collect this data manually or through third-party services.
Accessing Instagram Insights
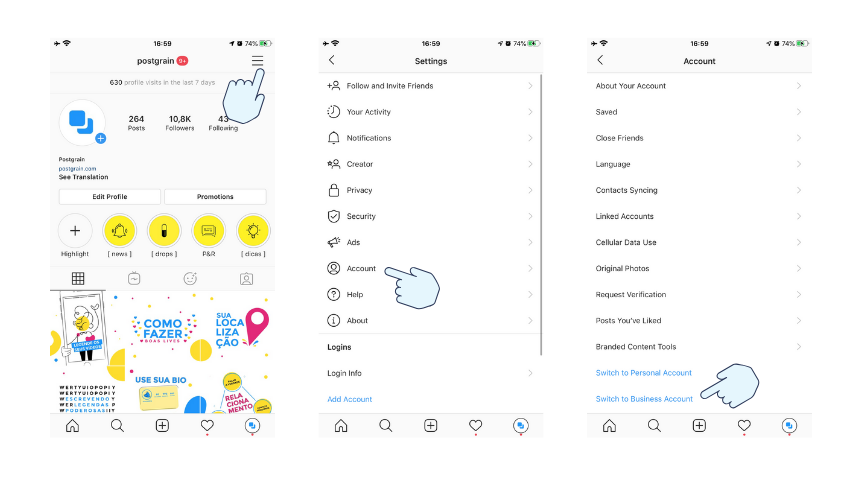
First of all, if you haven’t donne so, you need to turn your Instagram account into a business profile. Open your Instagram profile and click Settings (gear on iOS or three dots on Android). Then just select the option “Switch to business profile”.
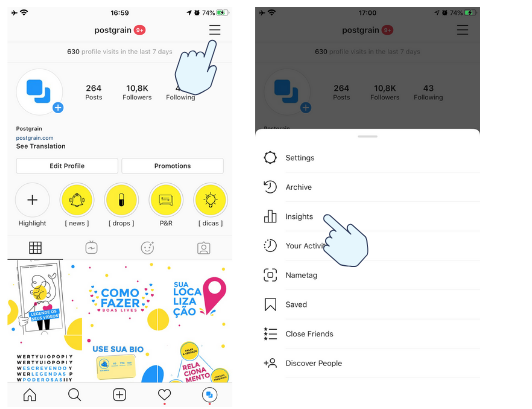
With your business account enabled, you may notice a new icon on your profile: a bar chart. Click on it and you will seeing Instagram Insights!
Analyzing the metrics with Instagram Insights
The 2018 Instagram Insights update gave us three tabs of data: activity, content, and audience.
Here are some tips on what you can get from each of them:
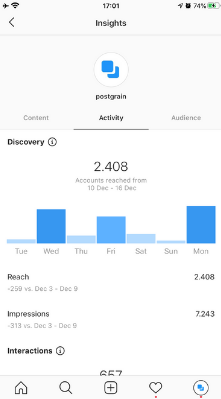
Activity
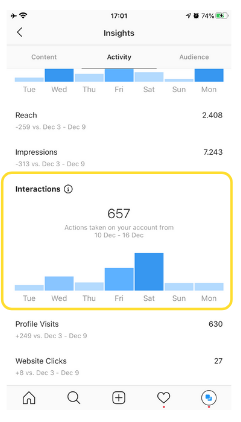
Interactions
From the start, you will be able to see data about the interactions on your posts from the past 7 days. Below you can also identify which days people have most clicked to see you profile. If you want to have the actual numbers breakdown, just tap on the graph to show/hide.
Interaction data generally reflects the days you made the most posts versus the days you made the few posts or none at all. Therefore, to analyze this data more clearly, you should keep a consistent pace in posts (one per day, for example). This way, you can understand through interactions what content has led followers to interact with you the most.
Call to action (comments like “comments down here” at the end of the text) can also increase these numbers as they lead users to comment in your posts.
If you saw good results in any post that didn’t have a call to action, pay attention to the post’s content: it may be a hint of what your audience likes the most.
Profile Visits
Just below interactions, Instagram Insights gives you the number of visits your profile has received in the last few days. This metric also offers a comparison with the previous 7-day period.
In this case, we had 137 more profile visits from April 25 to May 1 than May 2-8 (when we collected this data in the app). This is another number that may reveal what worked well for your profile.
And once again, it’s important that you keep consistent with your tactics to be able to read this data better. After all, if you posted less content in the past 7 days, it’s clear that visits to your profile will be less seen than the current period.
Bio-linked publications may increase this number. After all, to access your bio link you need to visit your profile. Please note if you have made any such post in recent days.
Website Clicks
Scrolling down the page you will get the number of clicks on link. Like other data, this metric also provides a comparison with the past seven days.
How many clicks on your bio link did you get this week? Was it more or less than in the past period? Again, calls like “link in bio” are crucial for this type of metric.
Other factors that may affect this metric are the launch of a new product or promotion, for example.
Emails
Represents the number of user tapped to send an email to your business. Calls to action and promotions are types of publications that may interfere with this number.
This metric will also vary greatly from profile to profile. For example, many tattoo artists usually sign contracts and design budgets via email. In these profiles, this metric is sure to be higher. In other profiles, this rate will be quite lower and may not be a problem as it may not be the goal of the company.
Discovery
Here you will see both reach and impressions from your posts over the past 7 days. This data includes both your followers and the people who discovered your posts by chance (on the explore page or via hashtag/location tags).
Like before, you can click the bar graph to get the exact numbers.
Reach
How many unique accounts have seen any of your posts? This is the data you’ll see here. In this section, there is no distinction between “follower” and “new user”.
Reminder: you can only access this number by viewing each post individually.
Don’t be surprised if your reach number is positive over the past period while your impression number is negative. This is entirely possible and even a good sign if your goal is to reach more people. It means that your content has reached different people, instead of showing the same post to the same users over and over again.
Impressions
This number is usually greater than reach precisely because a single user can see your post many times. And every time they see your post, Instagram counts another impression.
Here, we can’t see exactly which posts generated the most impressions.
Tip: when in doubt about something, click on “What does this mean?” Below the page, Instagram gives an explanation of each item. ?
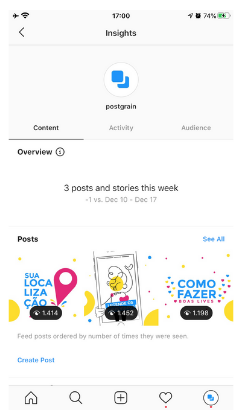
Content
In this section of the app, you can collect more targeted data from each post. In addition to showing you how many posts you made during the week, Insights also sorts them by impressions or reach, as you prefer.
You can also compare with previous periods (7 or 14 days) and see data from stories and promotions.
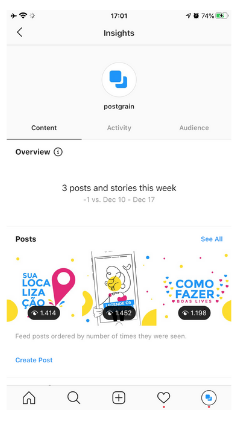
Feed
The general feed insights page sorts the latest posts from your profile by the number of impressions, that is, the number of times they were viewed. To access the full report, click View All.
You can also filter this data by time (7 days, 30 days, 3 months, 6 months, 1 year, or 2 years) and by metric (reach, impressions, site clicks, etc.). Just click on any of the blue words that Insights will open the options to choose from.
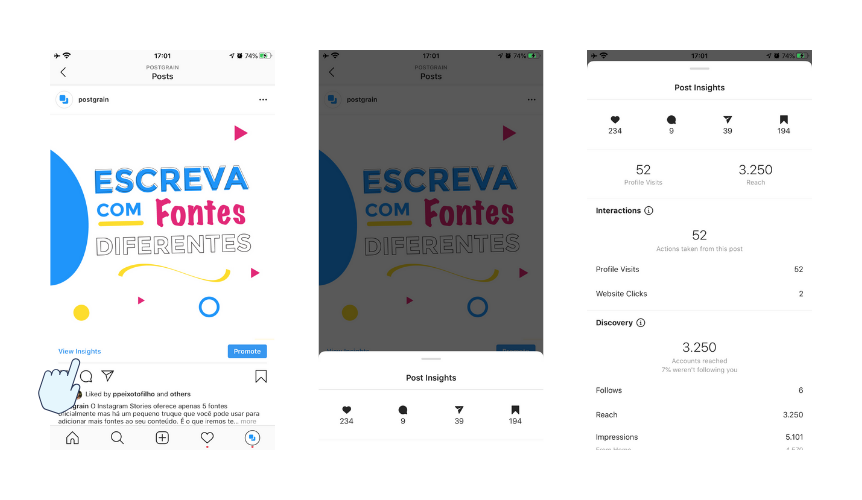
To review posts individually, click on any post and then View info below the media. You will have access to the reach number of that post and how many visits it brought to your profile. Also, the ribbon icon on the right is the number of people who saved that post.
Don’t you know what a ribbon is and what it’s for? In this blog post we explain this to you and 14 other “hidden” tips in the app, which you may not know yet. ?
Analyzing posts individually
In this part of Instagram Insights we can get more specific numbers of who we hit with our post: how many accounts did you reach in total and how many were not following you? The app gives you a percentage of it! ?
The cool thing about this is that you can know exactly where these people who were reached by your post came from:
Home: your followers, who viewed your post in their feed.
Explore: people who viewed your post through the Explore tab.
Profile: people who visited your profile and just clicked on your post.
Location: people who viewed your post through the location feed.
Hashtag: people who viewed your post from a hashtag search you entered in the post.
Other: when your post is sharing via DM or is clicked from the Following tab, which appears in the app notifications.
Many times you will only see some of these metrics, such as our post below. This means that no one arrived at our publication through the explore tab, nor localization, for example.
See why it’s so important to use hashtags and location tags in your posts? These numbers can also help us know which hashtags work best for our profile.
Test a hashtag group on one post and the same group – modifying only one tag – on another. A possible variation in the number of impressions per hashtag may tell you if that tag you added performs better than the other tag.
Just remember not to copy the same group of hashtags multiple times and in very close posts, ok? Instagram sees you as a spammer according to some hashtag attitudes.
Another cool test for collecting insights is with location tags. Which posts have you received the most views by location? And what location did you put in these posts? Bet on it more often!
For now, will we skip Stories’ part to talk about her up front, okay?
Promotions
In the last session of the “Content” tab, you will find the results of your promotions created by the app itself.
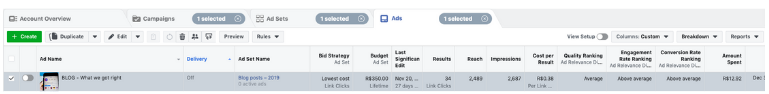
Note: ads made through the business manager will not appear on Instagram Insights, only ads that are produced directly on Instagram.
In the app, the information is divided into two tabs: original, which refers to the organic results of your publication and promotion, which are the numbers you got through the ad.
Here at Postgrain we do not usually make ads for Instagram because we found the most complete Facebook business manager for this kind of action.
Anyway, the original promotions tab is very similar to the feed posts: you will also be able to see the visits that each post generated to your profile, the number of people who saw your ad – and how many were not following you -, the number of impressions and the range.
You’ll see repeated data on the promotion tab, but pay close attention because it concerns your ad, ie who saw your post from the promotion.
You can also observe the characteristics of the audience that saw your promotion (gender, age, and location). Plus, Instagram Insights shows you how much you’ve already spent on that campaign. This is useful for you to get an idea of how much you need to invest to get an X result.
So if you’re expecting to receive X visits or X site clicks or X views, it’s a good idea to follow the promotion often. If you reach the goal ahead of time, just stop the campaign.
There is no “right result” in Instagram ads. The numbers should and will vary according to their purpose. And it’s impossible to say whether a campaign worked or not with so little activation time or little money spent. So don’t worry if you are seeing very low numbers: you have to let the results begin to appear!
If you want a better idea of the outcome of your campaign, use the business manager. All ads you make through the Instagram app will appear there as well. From the manager you collect a super important metric: cost per click. This allows you to define whether it was profitable to make the announcement or not.
Audience
Here is the part of the tool that you can learn more about your audience, the type of content they like best, and the best time to make that publication rock. The top gives us an “overall” of our follower base: the total number and how much we lost or gained over the past 7 days.
This type of information can greatly help you target your Instagram ads. By understanding the characteristics of your audience, you can reach them with much higher quality and also find more like-minded people who already follow and interact with you.
Demographics only appear on accounts with more than 100 profile followers, ok? So if you already have a larger base than this, let’s see what you can get from the app:
Genre
A pie chart shows you how your audience is divided: Is it mostly male or female? If you already do data analysis on other networks or on your own site, you probably already know which genre stands out.
Still, it’s always possible for Instagram’s audience to be different from other networks and the audience of your product or business (the app itself and the content you post on Instagram can influence that). Therefore, be sure to pay attention to this data.
Age
Here you find out the most common ages among your followers. You can also filter this age group by gender – and it may change depending on the gender you choose.
Gather this information to better target your ad: If you’re creating a campaign for 25-34 year olds, take a look at the genre that stands out in that range and further specify your ad!
Top Locations
Where do the people who interact with your Instagram profile live? Instagram Insights shows you the top 5 cities as well as the top 5 countries where your followers belong.
This may surprise many companies, who often think they speak only to Brazil when, in fact, they have a large audience out there. It can also show you a way forward in language: what cities am I talking to? What slang words do they use there?
Followers
This is one of the best features of Instagram Insights and certainly one of the most used. Here you can find out which time your followers are usually online.
Regarding the time, Instagram averages the time followers stay on Instagram on a typical day. As for days, Instagram shows the days of the week that your followers are most active on the platform.
Of course this data cannot be taken to the letter and testing to find the best time to post on instagram is super important, but this function can give us a great tip – especially about what time not to post at all.
Instagram Stories
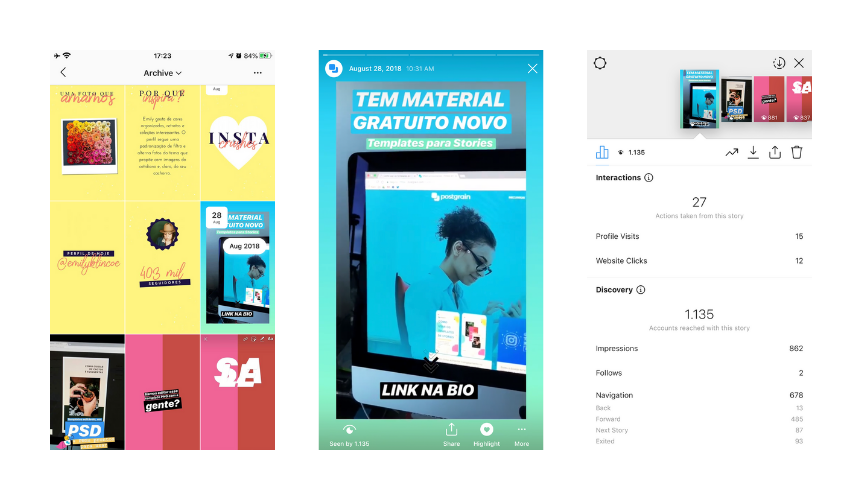
The Instagram Insights for stories portion varies by mobile phone operating system. On iOS, you have access to all metrics for each post just by clicking on it and pulling up the screen. Then click on the bar chart.
Instagram Insights Print on Stories Tab on an iOS Phone
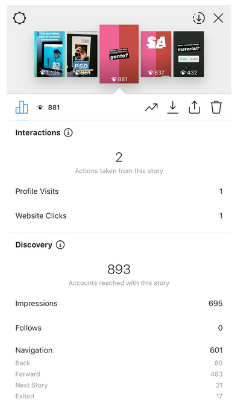
We don’t know why yet, but on Android you need to apply filters one by one to get the results. Instagram Insights only shows this summary of the photo above if your story is still active within 24 hours, as in the image below:
Print from stories on instagram insights by android
If the story you want to analyze is already missing from the tool, you need to apply each filter one by one to get the numbers.
Analyzing stories
Reach
Analyzing the reach of stories is a little different than how we do with a regular feed post. You sure have come across that profile that put so much history that the bars up there were tiny, right?
Yeah! This may be a factor in your falling range. People have realized that you are a spammer and have blocked you from the Stories bar or, as people often pass their stories, the Instagram algorithm has realized that you should not put your profile among the first.
Another possible factor for a fall in reach is infrequent and consistent story publishing. It’s good to create the right times and days to post. Also, placing location tags, hashtags, and tagging people will also help you get a good number on this metric.
Impressions
Were you looking for a metric that said whether your content was good or not? Well, you probably did. The number of impressions is all about the quality of your stories.
Boring content will easily be passed over or, if not, will be seen only once. You need to create such compelling photos and videos that make people want to come back to see you again. Funny media that brings a surprise element or shows different perspectives on a subject can be the answer to that. Test!
Hashtag + Location tags
Using hashtags and location stickers not only helps you increase your reach and impression rate. Using these features you can even appear in the stories highlight of a location or hashtag.
But how do I know if I’m showing up on these highlights?
Stay calm! Instagram alerts you when a photo or video of you is added to a group of location or hashtag stories. As in this image below:
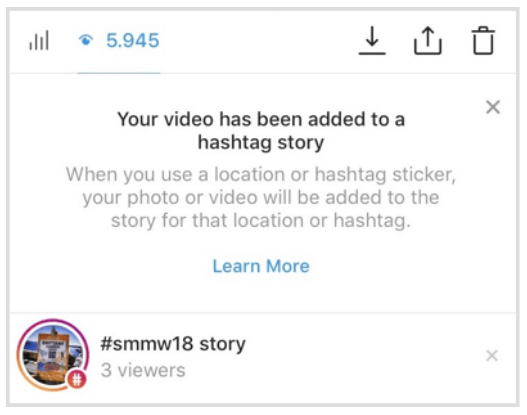
Image from Social Media Examiner
Insights lets you know the number of people who don’t follow you who viewed that story from the spotlight.
The Stories data also gives us a good clue as to how users behave with our content. In addition to raw numbers, insights also give us ways to interpret user behavior through tap metrics.
Taps forward
They represent the number of ringtones users have made to advance to their next story. Having a high number of ringtones to advance is not cool. This metric may indicate that you made many irrelevant or uninteresting stories.
A misplaced story with cut information can also cause people to tap forward. If you still do not know the ideal size to produce a story, rest assured that in this post we detail all the formats accepted by insta in 2018. ?
Another factor that may increase your number of ringtones to move forward – but not necessarily the user’s wish – is the misplacement of location stickers, hashtags or people tagging.
If you place them too close to the right side of the screen, the user may want to click on it, but eventually move on to another story. So, note that not to forget: never put too much stickers on the right or left, because this can give you a false number of ringtones to return too, which we will see below.
Taps to go back
Having a good rate of taps to go back is a great sign. It usually means that people liked your content so much that they wanted to come back to see it again. This will also influence your impression metric, which will be higher.
Exits
Represents the number of people who left your story before it ended.
Exits happen when: a user goes from your story to the next, closes Instagram while viewing the story or pulls the screen down, leaving Stories and going back to their feed.
Instagram has not yet made clear how we can differentiate these from the “next story” taps. Therefore, this number ends up representing not only who wanted to leave your story, but also who tapped forward and went to the stories of another user.
Anyway, it is good to pay attention to keep this rate always low. Increasing it may reveal a possible flood you are causing on your followers’ profiles and it may lead to you being blocked by them very soon.
Answers
This metric represents the number of times your story has been answered. Needless to say, this rate should always be high, right? Using calls to action or even new Instagram features can raise that number. Stay tuned!
Next story
This is the number of rings for the story of the next account. As I said earlier, some cases of exits may be accounted for here and vice versa. Instagram has not yet made clear how we can differentiate each case.
Tip: If your idea is to analyze content, a good way to reap these results is to produce a sequence of stories that talk about the same subject every day or every week. So after a period of testing different content you will be able to define which theme has made your audience engage the most.
It’s a pity that Instagram still doesn’t provide data about the story’s Lives.
Tracking Link Metrics in Stories
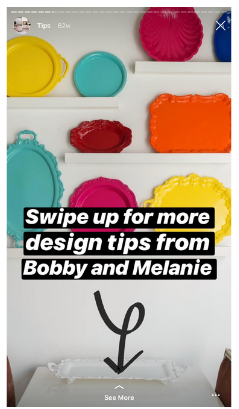
If you have a profile with over 10,000 followers, you have most likely already used the add link in a story feature to get the user to your site. With this feature, you can convert in-app from a CTA button (call-to-action) in the post itself. Thus:
One feature still missing from the analytics tool is metrics that calculate link performance in stories. But rest assured that we will teach you a way to do this:
Using Google Analytics + UTM parameters to track links
Quick explanation: UTM parameters allow us to track where and by what means users who clicked on our link came. All large companies use these off-site parameters, such as Facebook, Twitter, Email, etc. This is the only way to track which channels are working.
And with Instagram is no different. So whenever you link to your stories, create a UTM parameter first.
- Go to Google’s URL builder
- In Website URL paste the entire link you will put on Instagram
- In Campaign Source you will place the website that the link is inserted into. Where did this link come from? For Instagram Stories, put stories
- Campaign Medium represents the means by which that link reached people. So put instagram
- In Campaign Name you will name your campaign so that by the time Google Analytics tracks you know exactly which story it was. Don’t use hyphens, spaces or capital letters, ok?
- If you’re new to this, do not use Campaign Content. Leave it blank.
All set! Your link is perfect to be tracked. Now just put it in the story!
When you want to analyze his results, go to Google Analytics > Acquisition. Click on Social Networks> Network Referrals and after that, click on Instagram.
Conclusion
As a free tool, Instagram Insights proves to be a great hand on the wheel for analyzing Instagram results. Without the app’s free native feature, we would only be able to collect the likes and comments numbers.
With metrics that involve even posts in stories and data about our audience, it is possible to guide our content production in a more qualified way, already knowing what works and what is no longer worth doing.
So what do you think about Instagram Insights? Tell us in the comments! 🙂